The indexes finished down for the month - not a good sign. Reviewing my market indicators... We had a 90% down day on 1/29. The McClellan Summation index peaked over 250 at the beginning of January, the highest I have history for (back to 2001) and appears to coincide with a recent market top at the time. Although I think the market goes lower, I can't imagine the Man letting the market tank just as everyone is engorging their IRA's for the year. Why not let the peasants drink their cool-aid before telling them it's poisoned?
After reading some of Harry Dent's research, not even considering going long in the market for at least a few years and my indicators confirm some kind of turn. Although I will continue short-term trading and hone my day trading skillz.
Gold closed above the 10 month SMA. A bullish sign...
Have many sector RSI signals. Have to figure out where to focus next week.
Harry Dent is my new Peter Schiff
,
Labels:
Economy
Got an e-mail tonight from a personal growth site pushing a webinar featuring information from Harry Dent about what/when/how to invest in the coming years for the big downfall. Well, instead of paying for the webinar I Googled his name and quickly became enthralled!
I first found a link to a small book review and a chart that accurately predicts what's going on now. Then was amazed to learn the book was written in the 90's. Then looked on Amazon for all his books and found The Great Depression Ahead. I'm going to the bookstore tomorrow to check it out and have ALL his books on order from the Library (they all have waiting lines).
Then found some free stuff on his website. And some videoz on CNBC and FOX. After recommending gold, it just happened to take off that day or the day after...
His generational waves seem to coincide with the Kondratieff waves and they both point to a shit storm.
IBD Watch List
,
Labels:
Watchlist
Today was a follow-through day for all major indexes. FMOC was pretty much uneventful. FED to create a bad bank to hold all the crappy assets.
Today's scan about 40 stocks around some kind of support/trend line: DLTR MNRO TDG GMCR JOSB STRL HANS THOR SXL GTIV CMTL LHCG CFL TNH BLUD ASEI MYGN CMN HEI ATHN HMSY MANT INSU NCIT BKC GILD QSII DTV AAON HS AIPC INT LPHI SJI EPIQ NFLX NITE CEPH CWT SHEN AZO TWGP UBNK

DLTR looks real interesting.
Today's scan about 40 stocks around some kind of support/trend line: DLTR MNRO TDG GMCR JOSB STRL HANS THOR SXL GTIV CMTL LHCG CFL TNH BLUD ASEI MYGN CMN HEI ATHN HMSY MANT INSU NCIT BKC GILD QSII DTV AAON HS AIPC INT LPHI SJI EPIQ NFLX NITE CEPH CWT SHEN AZO TWGP UBNK

DLTR looks real interesting.
Traded SPY
,
Labels:
Trade
Traded SPY on potential breakout, but adjusted stop too soon and got... stopped out! Go figure... At least broke even.
Starting to record my trades live with jingproject.com for setup, execution and review to help improve trade discipline. Will keep them offline, at least until I get more proficient.
Starting to record my trades live with jingproject.com for setup, execution and review to help improve trade discipline. Will keep them offline, at least until I get more proficient.
IBD Watchlist
,
Labels:
Watchlist
Keeping my eye on these IBD stocks... Support: MLHR, Resistance: PETM CVH HWAY NOC AGP HUM TDG AET, Breaking upper trend: MOH MD GR KMX DVA PAY UAM
Could get some movement on FMOC comments on Wednesday and possible follow through if mkt goes positive.
Could get some movement on FMOC comments on Wednesday and possible follow through if mkt goes positive.
Charts for the week
,
Labels:
Chart
Updated my charts a little by adding horizontal price pointers so they're easy to see on the price scale. Added auto-trend lines in yellow. Also updated my thumbnail generator to use GIF for thumbnails so they're half the size and spit out the template for the blog entry. Things are getting easier. Will make the price color white to see if that makes the thumbnails easier to read.

PETM messing with resistance. If the market turns either way, it will probably follow.

MLHR will most likely head south. Who is buying office furniture in this environment? And with all the businesses going under, there will be a big secondary market. Just like when Enron collapsed, you could get Aeron chairs for cheap!

HUM is another one that can pop.

CSTR will benefit from everyone cashing in their piggy banks. Which reminds me...

WCG broke out of a symmetrical triangle. Could use a little test before making a move.
TECH is testing support
,
Labels:
Chart

TECH is testing support. Could get a little bounce, but the market is pretty messed up right now and this is a descending triangle pattern.
Pepsi and others
,
Labels:
Chart

PAS looks interesting. Found it through a finviz.com scan. No annotations, I think it speaks for itself.
Here are a few charts from the NASDAQ 100 that look interesting:

APPL will gap open in the morning after positive earnings tonight. It reached into the low 90's. Will probably pull back a ways into the gap.


Dow Up 3.5% after Obamanation
,
Labels:
IBD,
Market Wrap
Big reversal today from yesterdays big slide. My IBD scan shows 17% of IBD 100 (that's 17 stocks for the short bus riders) hovering around recent resistance (potential buy points). CMTL is hovering around it's support area, the only one of the bunch according to my scanner anyway. The financial inverse ETFs tanked big time.
Took a small position in JPT

Took a small position in JST today. It's been testing support for a while and has a potential for a small bounce and potential large bounce. The chart is from yesterday when I ran a EOD scan.
Palm hits the target area
,
Labels:
Chart

PALM completed a reverse head and shoulders pattern and broke out the day after their new Pre was demoed at CES. I made a price target of "8ish" that day, but didn't take a trade. The target was based on the resistance, but took a look today and noticed the H&S pattern.
90% Down Day & McLellan
,
Labels:
Market Wrap
According to my home-brewed indicator, today was a 90% Down day (meaning 90% of overall stocks were down). Although not as significant as 90% Up days according to the creator, we had one today and one on 1/14/09, which was the first since 12/1/08. However, that was a blip as there were two 90% Up Days the week before which is a good sign the market is about to rally (which it did).
The McLellan Summation Index has also rolled over a bit. Although it could reverse, my feeling is it's not going to happen. (It just briefly turned positive since going negative in June '08.)
The McLellan Oscillator also reached over 300 the first week of January, which is a sign the market is overbought and most likely to take a breather (or correction).
One last little tidbit is there is also a strong 20/40 week cycle coming into play. The various dates I used had a cycle "hit" from about 1/11/09 to 1/23/09 as setup in my Google Calendar as a reminder. Kind of strange it just happened to be around inauguration day!?

Obama Wins, Market Loses!

The TICK had a couple positive pulses up around the time Obama took the reigns. Then it was down hill from there!
CTSH

CTSH could hit $27 area if it can break out of the short term resistance. Or head south to 16 if the market turns sour.

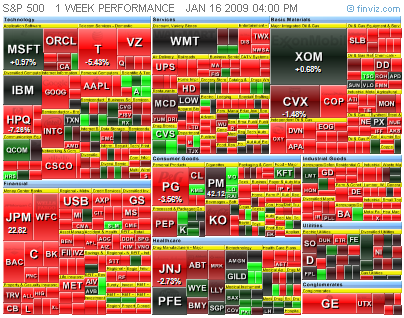
S&P 500 Map 2009-01-16
A lot of red last week! Every sector is down with Financials getting hit with BAC and C earnings.
Subscribe to:
Posts (Atom)

